 Pulse
Pulse: 16 November 2026
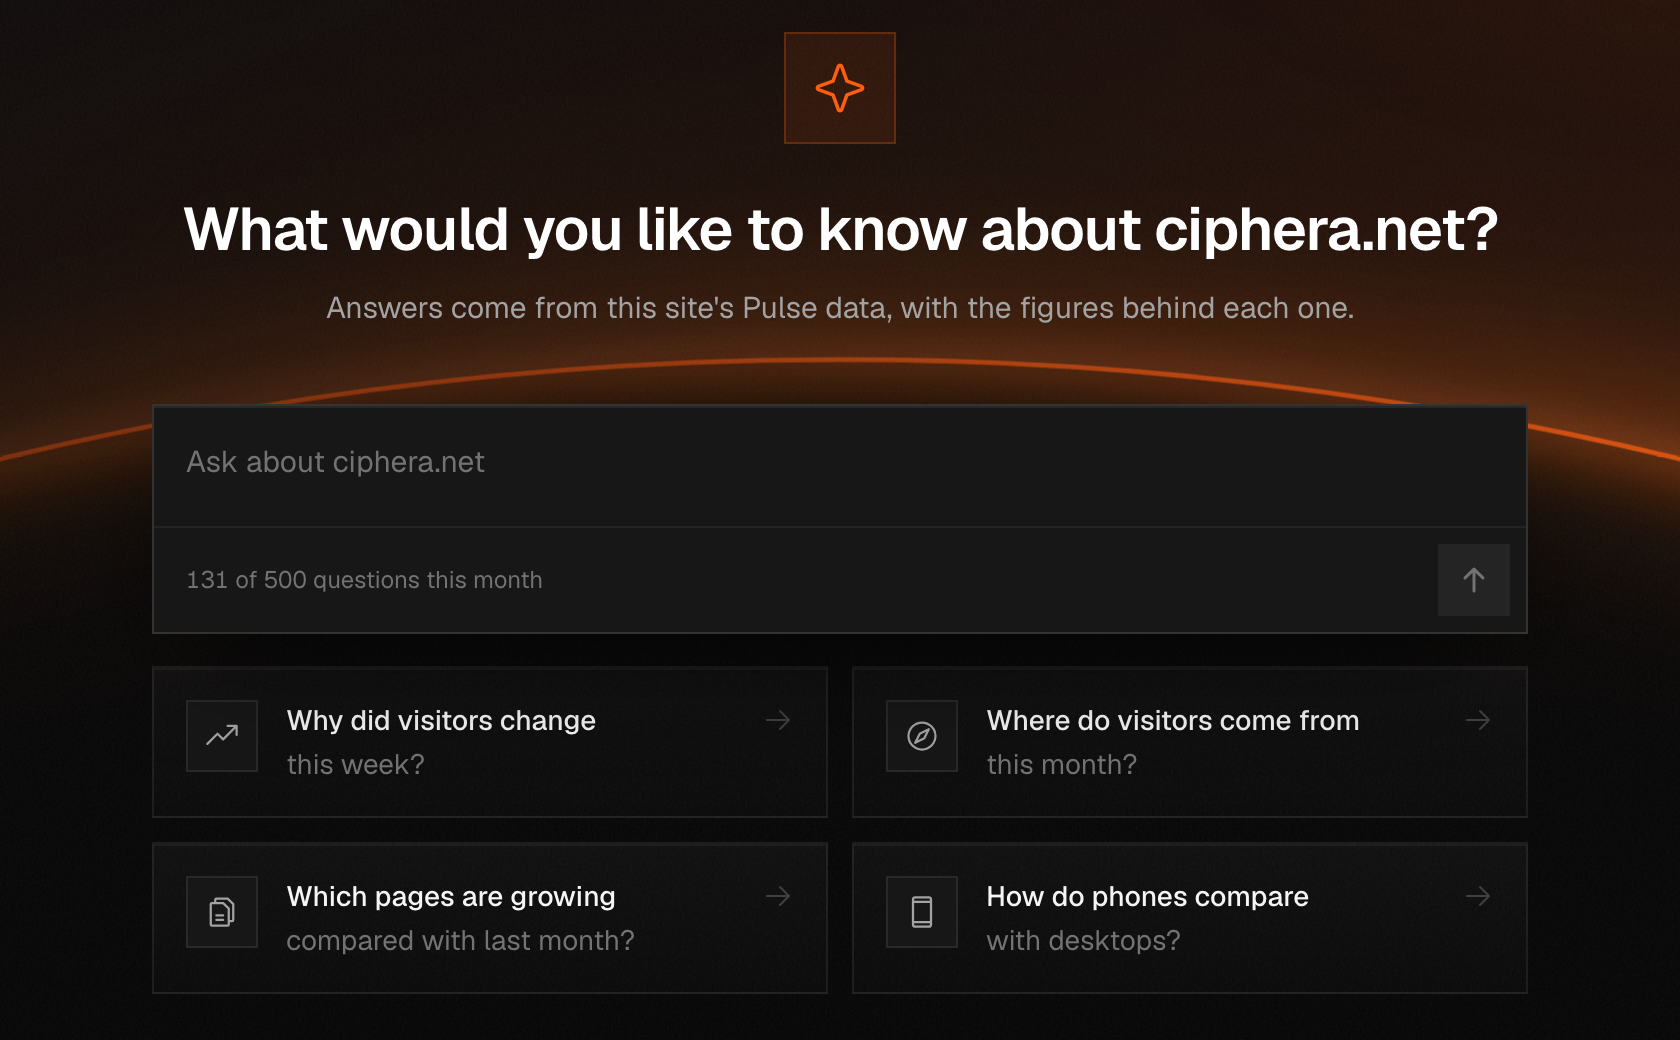
Pulse Analyst is out of beta and on for every team. It answers questions about your site in plain language and shows the figures behind each answer, so you can check them. Find it in the menu under Search, where the question box shows how many of this month's questions your team has used.
New
- The dashboard's filter is one search field. Type a country, a page or a source, then press Enter to add it, or Alt and Enter to leave it out (Option and Enter on a Mac). Press F to open it from anywhere on the page.
- Pulse now emails everyone who can manage billing when a team's payment method changes. If you did not make the change, the email says where to check it and who to tell.
Beta
- You can filter the dashboard by an event. Choose Event to keep the visitors who did it, or "is not" for those who did not, with everything they did that day in view; Event property does the same for an event that carried a given value, such as the plan picked at signup. A funnel's page, Journeys and Settings → Export take the same filter, and a value in the Events block or an outbound link filters with one press.
- Each date range has a keyboard shortcut, shown beside it in the date menu. Press W for the last 7 days or A for all time, C to choose your own dates and R for realtime, and use the left and right arrow keys to move the range. Press ? to see every shortcut.
- With event filters on, pressing a row in the Events block filters the page by that event, the same way pressing a page or a source does. The arrow at the end of the row opens the event's properties.
For everyone
- The new dashboard is out of beta and on for every team. Sources sit beside Pages, every block is the same size, and the filter and the date range stay in view while you scroll. The page ends with a chart of your funnel and a map of the paths visitors take, beside the hours your site is busiest, with search clicks, uptime and performance in three small tiles.
- The monthly summary email is out of beta and goes to every team. A monthly summary now arrives on the 1st of each month, with last month's visitors, top pages and top sources for each site that had visits. Every member gets it, and each person can turn it off in Settings → Notifications.
- Saved filters are out of beta and on for every team. You can save the filters that are on under a name and put them back with one press. The filters box has a "Save these filters" row, and the saved filters appear at the top of the Filter menu for everyone in your team.
Improved
- The new dashboard's Events block shows your own events and the automatic ones on two tabs, with the number of visitors who did each one and their share of all visitors. Press an event to see its properties beside the list. You can sort the Events and Pages lists by pressing a column's name.
- Settings → Notifications lists a new group, Account, for the emails before and after an inactive team is deleted. Like Billing and Security, it is always on.
- The dashboard now loads icons before you need them. The icons of a block's next page, the site switcher's icons and the picture in What's new are fetched ahead of time, so they appear sooner.
- In every menu, the row under the pointer is now highlighted all the way to the menu's edge. Before, the first and the last row left a thin strip of empty space above or below their highlight.
- Pulse now tells you sooner when a site stops sending data. A site that sends data every hour counts as quiet after a day without any, and a site with fewer visitors gets as long as its own quiet spells usually last, up to a week. The site's tracking status in Pulse changes at the same time as the email.
- Every empty state in Pulse now looks the same: an icon, a title, a short line and, where there is something to do, a bordered button. Empty dashboard blocks, pages and settings sections used to come in different styles.
- Every list on the dashboard can now be sorted from its heading. Press "visitors" over Sources, Locations, Technology, Entries or Exits, or "clicks" over Outbound, to order the rows from high to low, and press it again for low to high.
- With two or more filters on, the filters box in the dashboard's toolbar has an x that removes them all at once.
Changed
- Your tracking script is now one line for every site, and your settings in Settings → General apply to it on their own. A change to scroll depth, outbound links, file downloads, clicks, copies and forms, Do Not Track or Global Privacy Control takes effect within a few minutes of saving, and the script on your site stays as it is. If you added options such as data-no-outbound to your script by hand, set them in Settings → General instead, because the script no longer reads them.
- The follow-up email about a site that still sends no data comes after 14 days instead of 30. The reminder after a failed renewal payment comes a week before the plan would end, instead of four days before.
- Teams with no sign-in and no data for 90 days are now deleted, after two emails to every member, 30 days and 7 days before. A team on a paid plan is never deleted for inactivity, and one sign-in before the date keeps everything.
Fixed
- The card that follows the pointer on a chart is no longer cut off near the chart's right edge. Before, at a few points close to the edge its right end, the number, ran past the chart.
- In realtime, an empty dashboard block no longer says nobody is on the site while the counter shows visitors. It now says what it has none of, for example "No outbound clicks in the last 5 minutes."
- An empty dashboard block now says why it is empty. It tells you when a filter matches nothing and lets you clear it, when the chosen range has no visits, and when the site has had no visitors yet. The "Install tracking script" button is gone from the blocks, so a site that already reports is no longer asked to install the script.
- The visitors and views labels on the dashboard's blocks now sit directly over the numbers they name. They were 16 and 24 pixels off to the side.
- A filter set from the Languages or Timezones tab of the Locations block now reads "Language" or "Timezone" in its pill. It used to show the lowercase internal name.
- The Events block on the dashboard now pages through all of your events. It used to stop at the seventh, with no way to see the rest.
- Choosing a custom range no longer makes the date picker jump. The calendar now opens beside the list of ranges, which stays where it is, and "Custom range…" closes it again. On a phone the calendar opens under the list.
- With a filter on, an event's properties on the dashboard now follow the filter. Before, the event's count was filtered and the property values under it were not, so the two did not add up.
- The cards on Your Sites show each site's name and visitor count in the light theme. Before, that text was dark on the cards' dark shade and could not be read.
- Resting the pointer on a rounded number in the Sources and Pages lists now shows the exact count, as it does everywhere else on the dashboard.
- In the Campaigns tab, a source tagged with more than one spelling is now one row. Before, a link tagged utm_source=twitter and one tagged utm_source=x each got a row, and both rows read "X". The same now holds for outbound links, browsers, devices and languages: two stored values that read the same on screen are counted together.
- The note your site shows after you use Stop counting me or Count me again now also appears on sites whose Content Security Policy enforces Trusted Types. Until now it never appeared there, and a visit opened with Count me again was not counted. If your policy lists the Trusted Types policies it allows, add pulse to that list.
- The picture at the top of What's new now shows in full, as it does on the changelog.
- What's new now shows a new post while Pulse is open. It checks again when you come back to the tab and every 15 minutes, so you no longer need to reload the page to see it.
- An address that isn't a page, such as a mistyped link, now shows "Page not found" instead of the sign-in page.
- The live visitor count at the top of a site's dashboard leaves out bots that Pulse catches a few minutes after they arrive. Before, one of these visits could keep the count at 1 while the realtime view showed nobody. The realtime numbers in the API and the MCP server follow the same rule.
- Pulse now takes a returning bot out of the live visitor count and today's numbers about a minute after it arrives, whether or not it came through a link. Some of these visits used to stay visible for up to 15 minutes.
- Pulse now catches more automated traffic. Visits that scroll to the same spots every time no longer count as visitors, however long they stay on each page.
- Pulse filters out fewer real visitors when a bot keeps visiting with one screen size. Visitors on the same kind of device with a different screen are judged on their own visits.
- The Filter menu's list scrolls again. With many values, such as every page of a busy site, the rows ran past the bottom of the menu and over the page.
- The Filter menu draws each referrer's icon again, and a globe for a site without one, where it showed a broken image. Cities, regions, languages and timezones show their country's flag there, and channels show the same icons as in Sources.
- An event's properties now load in the Events block on All time for a site with more than a year of history.
- Pulse no longer counts visits from a copy of your site running on your own computer (localhost). Before, opening a local copy that carried your live tracking script added those visits to your site's numbers.
- The Campaigns tab on the dashboard loads again on ranges longer than a month, such as Last 3 months, This year and All time. On those ranges it showed "Couldn't load campaigns" while the rest of the dashboard loaded.
- Exports from Settings → Export that include the Goals or Events table work again. Choosing either table had made the whole export fail.
- Funnels load again for ranges longer than a month, All time included, on the Funnels page and in the dashboard's Funnels tab.
- The keyboard shortcuts list now names the right pages: G then P opens Pages, and G then R opens Performance. Pressing G then F to open Funnels no longer opens the filter as well.
Removed
- Scroll depth and the chart's choice between hours and days are no longer part of the dashboard. Outbound links are now a tab of the Pages block.